Introduction to Compound Annual Growth Rate (CAGR)


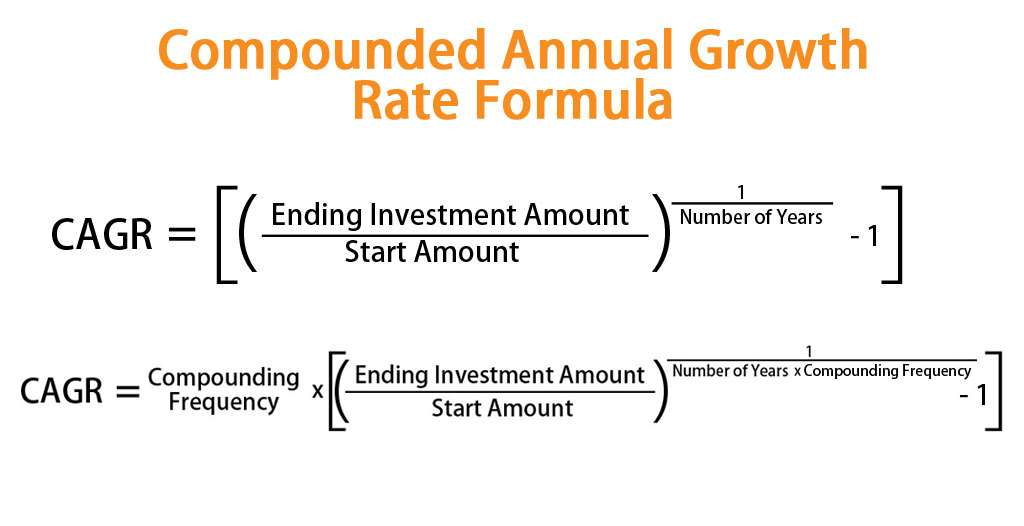
Compound annual growth rate (CAGR) is a metric for gauging an investment’s average yearly growth rate over a certain time frame longer than a year. It is computed through eliminating 1 and multiplying 100% after dividing the investment’s ultimate value by its initial worth.
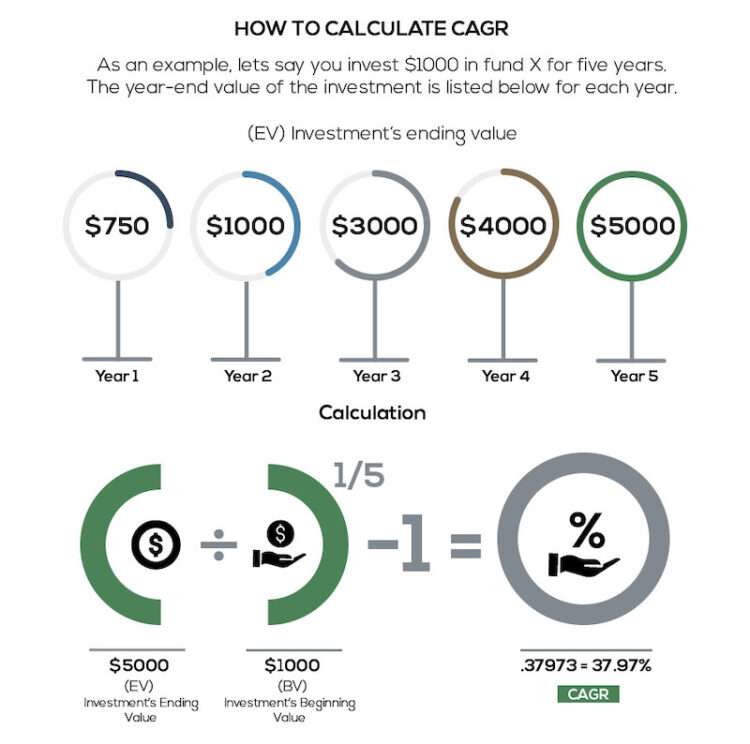
The CAGR, for instance, would be 10% if an investment started at $100 and increased to $200 over the course of five years.
The Formula and Calculation of CAGR
CAGR is calculated using a simple formula that considers the initial and final values of the investment, along with the number of periods. The formula can be expressed as:
\[ CAGR = \left( \frac{EV}{BV} \right)^{\frac{1}{n}} – 1 \]
Where:
- \( EV \) represents the ending value of the investment or business.


Why CAGR Matters: Benefits and Applications
- Evaluating Investment Returns
CAGR is invaluable for evaluating the performance of investments over time, as it considers the effects of compounding. This makes it particularly useful when comparing investment options with different compounding frequencies. - Analyzing Business Performance
For businesses, CAGR can help gauge the growth of key metrics such as revenue, profit, and customer base. It aids in identifying trends and making informed decisions for future expansion.
CAGR vs. Simple Annual Growth Rate (AGR)


CAGR is the compound annual growth rate. It takes into account the compounding effect of interest or growth over time. This means that CAGR is a more accurate measure of the true growth of an investment.
Real-World Examples of CAGR
Here are some real-world examples of CAGR:
- The S&P 500 index has a historical CAGR of about 10% over the long term. This means that if you invested $100 in the S&P 500 in 1928, it would have grown to over $50,000 by 2022.
- The Nasdaq Composite index has a historical CAGR of about 13% over the long term. This means that if you invested $100 in the Nasdaq Composite in 1971, it would have grown to over $100,000 by 2022.
- The Dow Jones Industrial Average has a historical CAGR of about 7% over the long term. This means that if you invested $100 in the Dow Jones Industrial Average in 1896, it would have grown to over $10,000 by 2022.
- The gold price has a historical CAGR of about 2% over the long term. This means that if you invested $100 in gold in 1971, it would have grown to over $200 by 2022.
- The yield on the 10-year US Treasury bond has a historical CAGR of about 4% over the long term. This means that if you invested $100 in a 10-year US Treasury bond in 1971, it would have grown to over $300 by 2022.


