Understanding Time-to-Event (TTE) analysis is essential for decision-making in the quick-paced world of data analysis. TTE analysis offers useful insights regardless of whether you work in healthcare, finance, or another sector that deals with events that happen over time. We shall examine the significance, techniques, and applications of TTE analysis in this article as we delve into its complexities.
- Introduction to TTE Analysis
- Understanding Time-to-Event Data
- Kaplan-Meier Survival Curves
- Types of Censoring in TTE Data
- Log-Rank Test for Comparing Survival Curves
- Competing Risks and Cause-Specific Analysis
- Cox Proportional-Hazards Model
- Parametric Models for TTE Analysis
- Non-Parametric Approaches
- Right Censoring and Left Truncation
- Data Preprocessing for TTE Analysis
- Applications of TTE Analysis
- Choosing the Right TTE Analysis Approach
- Frequently Asked Questions (FAQs)
Introduction to TTE Analysis
- TTE Analysis, also known as survival analysis, is a statistical method for analyzing the time it takes for an event of interest to occur.
- It’s applicable across various fields, including healthcare, finance, and engineering.
- TTE data often involves censored observations, where the event hasn’t occurred by the end of the study.
- The Kaplan-Meier estimator is a key tool for estimating survival probabilities over time in non-parametric fashion.
- The Cox Proportional-Hazards Model assesses the impact of multiple variables on event timing.
- Parametric models, like the Weibull distribution, make assumptions about the data distribution for precise predictions.
- Non-parametric methods, such as the Nelson-Aalen estimator, are distribution-free alternatives.
- Understanding right censoring and left truncation is essential for handling incomplete data.
- Data preprocessing is crucial to ensure the accuracy of TTE analysis results.
- TTE analysis finds applications in medical research, finance, customer churn prediction, and engineering reliability assessment, among others.
Understanding Time-to-Event Data
| – Time-to-Event (TTE) data involves observing events over time, but not all events may have occurred by the end of the study. |
| – Censoring is a common feature in TTE data, where some observations are incomplete because the event hasn’t happened yet. |
| – Key elements of TTE data include the time of event occurrence (or censoring), a binary indicator of whether the event occurred, and potentially, covariates or predictors. |
| – Censoring can be of two types: right censoring, where the event has not occurred by the end of the study, and left truncation, where observations are excluded before a certain time point. |
| – TTE data can be visualized using Kaplan-Meier survival curves, which show the probability of an event happening over time. |
| – The concept of hazard functions, which represent the risk of an event at a given time, is fundamental in TTE analysis. |
| – TTE analysis accounts for censoring and provides insights into event probabilities and survival times, making it valuable across diverse industries. |
Kaplan-Meier Survival Curves
- Kaplan-Meier Survival Curves is a powerful tool in Time-to-Event (TTE) analysis.
- They estimate the probability of an event occurring at different time points.
- Ideal for analyzing data with censoring, they consider cases where the event of interest hasn’t happened for all observations.
- The curve starts at 100% survival probability and gradually declines as events occur.
- At each event time, the curve steps down, representing a decrease in survival probability.
- These curves can be stratified by different groups or factors, allowing comparisons between them.
- Confidence intervals around the curves help assess the precision of the estimates.
- Kaplan-Meier curves are interpretable and useful for visualizing survival trends.
- They are commonly used in medical research to analyze patient survival rates after treatments.
- These curves provide critical insights into the timing and probability of events, aiding decision-making in various fields, including healthcare and finance.
Types of Censoring in TTE Data
1. Right Censoring
Occurs whilst the precise time of the occasion is unknown, however it’s miles recognised to arise after a particular time. Common in research wherein the follow-up ends earlier than the occasion happens.
2. Left Censoring
Happens whilst the occasion has already passed off earlier than the commentary length starts. This is
regularly encountered in retrospective research.
3. Interval Censoring
The occasion is understood to arise inside a particular time interval, however the actual time is uncertain. Common in research with periodic follow-ups.
4. Type I Censoring
Pre-decided take a look at cease time outcomes in censoring for people who’ve now no longer skilled the occasion with the aid of using that time. Typically utilized in medical trials.
5. Type II Censoring
Occurs whilst the take a look at ends after a sure range of activities had been observed, leaving the last members censored.
6. Random Censoring
Censoring instances range unpredictably and are unbiased of the occasion instances. This is not unusualplace in real-international research.
7. Informative Censoring
The censoring time is associated with the chance of the occasion. It can introduce bias if now no longer addressed appropriately.
8. Administrative Censoring
Occurs because of take a look at design, together with constant follow-up durations or take a look at termination, unrelated to player outcomes.
Log-Rank Test for Comparing Survival Curves
1. Introduction to the Log-Rank Test
The log-rank check is a non-parametric statistical technique used to examine survival curves from or greater corporations. It is broadly implemented in scientific and biomedical research.
2. Purpose of the Log-Rank Test
This check evaluates whether or not there may be a substantial distinction in survival distributions among corporations. It assesses the null speculation that survival curves are identical.
3. Underlying Assumptions
The check assumes that survival chances are proportional throughout corporations over the years and that censoring is non-informative.
4. Mathematical Framework
The check compares found and anticipated occasions at whenever factor the use of a chi-rectangular statistic. It aggregates variations throughout all time intervals.
5. Steps in Conducting the Test
Calculate found and anticipated occasions for every group.
Compute the chi-rectangular check statistic.
Compare it in opposition to a crucial fee or attain a p-fee.
6. Interpreting Results
A small p-fee suggests a substantial distinction among corporations. Larger variations advocate greater said disparities in survival experiences.
7. Strengths of the Log-Rank Test
It is straightforward to put into effect and does now no longer require assumptions approximately the precise distribution of survival times. It is powerful for censored data.
8. Limitations of the Log-Rank Test
The check may also lack strength whilst survival curves cross, and it assumes proportional hazards, which might not keep in all datasets.
Competing Risks and Cause-Specific Analysis
1. Introduction to Competing Risks
Explanation of competing dangers as activities that avert the incidence of the number one occasion of interest.
Importance of dealing with competing dangers to keep away from biased survival estimates.
2. Key Concepts in Competing Risks Analysis
Distinction among cause-unique and marginal hazards.
Understanding cumulative occurrence functions (CIF) and their interpretation.
3. Challenges in Traditional Survival Analysis
Limitations of widespread survival strategies withinside the presence of competing dangers.
Misinterpretation of Kaplan-Meier curves in such scenarios.
4. Cause-Specific Hazard Models
Definition and application of cause-unique chance functions.
Application to estimate the impact of covariates on unique causes.
5. Cumulative Incidence Function (CIF)
Method for estimating the possibility of a selected occasion happening over time.
Difference among CIF and conventional survival functions.
6. Fine-Gray Subdistribution Hazard Model
Introduction to modeling subdistribution hazards.
Benefits of the usage of Fine-Gray fashions in competing dangers analysis.
7. Comparison of Analytical Approaches
Key variations among cause-unique and Fine-Gray fashions.
Selection standards for suitable modeling techniques.
8. Applications and Case Studies
Examples of competing dangers in medical trials, epidemiology, and reliability studies.
Real-international insights from sensible implementations.
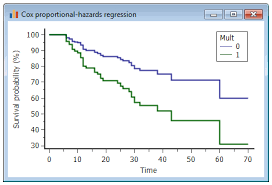
Cox Proportional-Hazards Model
| – The Cox Proportional-Hazards Model is a statistical technique used in Time-to-Event (TTE) analysis. |
| – It assesses the impact of multiple covariates (predictor variables) on the hazard, or risk, of an event occurring over time. |
| – The model assumes that the hazard ratios (the relative risks) of the covariates remain constant over time. |
| – It’s valuable for analyzing TTE data when you want to understand how different factors influence the timing of events. |
| – The model doesn’t make specific assumptions about the underlying distribution of survival times. |
| – It’s widely used in medical research, epidemiology, and other fields to study factors affecting patient outcomes or event occurrence. |
| – The Cox model provides hazard ratios, which indicate the strength and direction of the covariate’s influence on the event hazard. |
| – Proportional-hazards assumptions can be tested to ensure the model’s validity. |
| – It’s a versatile and powerful tool for exploring complex relationships in TTE data, allowing for practical and actionable insights. |
Parametric Models for TTE Analysis
| – Parametric Models in TTE Analysis assume a specific probability distribution for event times, allowing for precise modeling of survival data. |
| – One commonly used distribution is the Weibull distribution, which is flexible and can describe various shapes of hazard functions. |
| – Another distribution is the exponential distribution, which assumes constant hazard over time and is suitable for modeling rare events. |
| – The log-logistic distribution is useful when the hazard rate follows an S-shaped curve. |
| – Parametric models estimate parameters such as scale and shape to characterize the event time distribution. |
| – These models are advantageous when assumptions about the data distribution align with reality, as they provide efficient and interpretable results. |
| – However, if the distributional assumption is incorrect, the results may be biased. |
| – Choosing the right parametric model depends on the nature of the data and the research question, and model selection techniques like likelihood ratio tests can help identify the most appropriate model. |
| – Parametric TTE analysis is valuable in scenarios where understanding the precise shape of the survival curve is essential for decision-making or prediction. |
Non-Parametric Approaches
- Non-parametric approaches in Time-to-Event (TTE) analysis make fewer assumptions about the underlying distribution of event times, offering flexibility when data distribution is uncertain.
- The Nelson-Aalen estimator is a common non-parametric method used to estimate the cumulative hazard function, providing insights into event occurrence over time.
- The Kaplan-Meier estimator is another essential non-parametric tool that calculates the survival probability at various time points, accommodating censored data.
- These approaches are distribution-free, making them robust when data doesn’t conform to a specific statistical distribution.
- Non-parametric methods are particularly useful when the shape of the survival curve is unknown or complex.
- They are widely applied in medical research, engineering reliability analysis, and various fields where precise distributional assumptions may not hold.
- Non-parametric approaches empower analysts to derive meaningful insights from TTE data without relying on strict model assumptions, enhancing the reliability of results.
Right Censoring and Left Truncation
| – Right Censoring occurs when in Time-to-Event (TTE) analysis, some observations do not experience the event by the end of the study. These cases are marked as censored. |
| – Censoring is common in longitudinal studies and clinical trials, where the event of interest has not yet occurred for some subjects. |
| – Right-censored data can lead to underestimating event probabilities if not handled correctly. |
| – Left Truncation involves excluding observations that occur before a certain time point. It occurs when only subjects who have survived up to a specific point are considered. |
| – Left truncation can introduce bias if not accounted for since it excludes individuals who may have experienced the event before the study began. |
| – Properly addressing censoring and truncation is crucial for accurate TTE analysis, and various statistical methods are available to handle these challenges effectively. |
Data Preprocessing for TTE Analysis
- Data preprocessing in TTE analysis is vital to ensure the quality and reliability of results.
- Cleaning and validating the dataset is the initial step, addressing missing values, outliers, and data integrity issues.
- Censoring information should be accurately recorded, and left truncation, if present, must be appropriately managed.
- Covariates or predictor variables need careful selection, ensuring they are relevant to the research question and appropriately coded.
- Handling time-dependent covariates, if any, is essential to avoid bias in the analysis.
- Stratification by factors like gender or age may be necessary to explore subgroup differences.
- Data normalization or scaling can improve the stability and convergence of statistical models.
- Consideration of competing risks, where multiple event types may occur, is important in certain TTE analyses.
- Robust data preprocessing sets the foundation for meaningful TTE analysis, leading to more accurate and actionable insights in various domains, including healthcare, finance, and engineering.
Applications of TTE Analysis
| The Future of UID | Description |
|---|---|
| Emerging Technologies | – UIDs will continue to adapt to emerging technologies such as IoT, blockchain, and AI, expanding their applications. |
| Enhanced Security | – UIDs will play a pivotal role in strengthening security measures, particularly in a world with increased cyber threats. |
| Digital Transformation | – As businesses undergo digital transformation, UIDs will be fundamental in managing and securing digital assets. |
| Interconnected Devices | – With the proliferation of interconnected devices, UIDs will be crucial for seamless communication and management. |
| Privacy and Ethical Concerns | – The future will bring heightened focus on addressing privacy and ethical concerns related to UID usage. |
| Regulatory Evolution | – UID regulations will evolve to strike a balance between utility and privacy, shaping how they are employed in various domains. |
| Global Standardization | – Efforts to establish global standards for UID generation and usage will gain prominence for consistency and interoperability. |
| Biometric Integration | – UIDs may incorporate biometric data, offering even more secure and user-friendly identification methods. |
| Data Economy Impact | – UIDs will continue to impact the data economy, with potential shifts in data ownership and monetization models. |
Applications of TTE Analysis
| – Medical Research: TTE analysis is extensively used in clinical trials and epidemiology to assess patient survival rates, treatment efficacy, and disease progression. It helps determine the time it takes for events like disease recurrence or patient recovery. |
| – Finance and Risk Assessment: Financial analysts employ TTE analysis to predict investment returns, assess credit risk, and model default probabilities. It aids in understanding the timing of financial events and their impact on portfolios. |
| – Customer Churn Prediction: Businesses utilize TTE analysis to forecast when customers are likely to stop using their services, allowing for proactive retention strategies and personalized marketing efforts. |
| – Medical Research: TTE analysis is extensively used in clinical trials and epidemiology to assess patient survival rates, treatment efficacy, and disease progression. It helps determine the time it takes for events like disease recurrence or patient recovery. |
| – Engineering Reliability: Engineers apply TTE analysis to estimate the lifetime of components and systems, ensuring product reliability and safety. |
| – Social Sciences: TTE analysis finds applications in sociology and demography, studying life events like marriage, divorce, or retirement. |
| – Environmental Science: Researchers use TTE analysis to study environmental events such as the time-to-extinction of species or the duration of pollution effects. |
| – Manufacturing: TTE analysis helps assess the reliability and maintenance needs of manufacturing processes and equipment. |
| – Quality Control: It’s used in quality control to determine the time it takes for defects to occur in a production process. |
Frequently Asked Questions (FAQs)
Parametric TTE analysis assumes a specific data distribution, while non-parametric methods make fewer distributional assumptions, offering more flexibility.
Absolutely! TTE analysis is versatile and applicable across various industries, including finance, marketing, and engineering.
There are several methods to handle missing data, such as imputation techniques or excluding incomplete observations.
While TTE analysis can provide valuable insights, real-time predictions often require different approaches like machine learning models.
Popular software tools for TTE analysis include R, Python (with libraries like lifelines and survival), and specialized statistical software like SAS.
Censoring occurs when the event of interest is not observed within the study period. It’s crucial because it allows for the inclusion of incomplete data, providing more accurate estimates without biasing results.
A survival curve is a graphical representation of the probability of surviving (not experiencing the event) over time, typically generated using the Kaplan-Meier estimator.
Competing risks occur when participants are at risk of multiple types of events, and the occurrence of one type of event precludes the occurrence of another (e.g., death from different causes).